
From Dashboards to Decisions: Powering Product Strategy with Data
Client: Veteran Affairs
Timeline: August 2023 - July 2025
Role: UX Research Lead, Data Analyst
From Insights to Execution:
1. Identified a visibility gap in performance data
Stakeholders had limited insight into how Veterans interacted with digital health tools. Metrics expired too quickly and lacked connection to user behavior.
2. Partnered with developers to build sustainable tracking
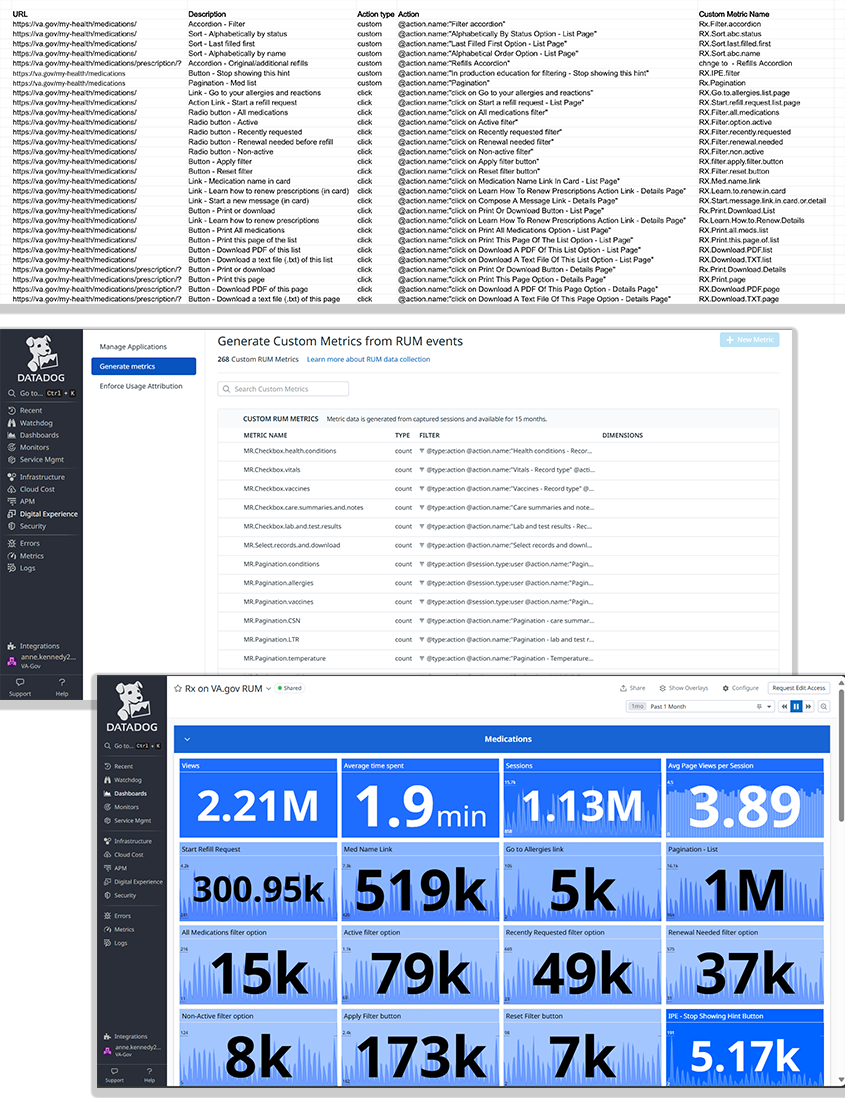
Collaborated with front-end engineers to install and configure Datadog agents, adding custom tags to capture detailed interaction events.
3. Solved the data retention challenge
Researched and implemented a solution for expiring metrics, creating custom metrics that preserved 15 months of data instead of 30 days.
4. Made data accessible and actionable
Built dashboards that translated raw data into meaningful, visual insights, earning recognition from VA product owners for clarity and usability.
5. Scaled impact through training and collaboration
Trained team members and stakeholders to navigate Datadog and access specific metrics independently, ensuring analytics became part of everyday decision-making.
Background: From Static Dashboards to Actionable Analytics
Data analytics for the legacy My HealtheVet platform were limited to a few static Power BI dashboards.
When deeper insights were needed, I had to manually query the massive SQL database, a process that was both time-consuming and technically complex.
The migration of My HealtheVet to VA.gov created an opportunity to modernize analytics, expanding from basic reporting to a comprehensive, scalable data practice that could support product decisions, performance tracking, and continuous improvement.

Building a Shared Analytics Vision
To ensure each of the three My HealtheVet products, Secure Messaging, Medications, and Medical Records, launched with meaningful, measurable success criteria, I led a series of data strategy workshops with product stakeholders.
We defined north star metrics that aligned with broader VA.gov goals for engagement and adoption.
I facilitated OKR and KPI sessions to validate key outcomes and prioritize what success should look like for each product.
I mapped product-specific metrics to user behaviors, enabling ongoing monitoring of performance and experience trends.
This collaborative process helped stakeholders move beyond surface-level reporting toward a shared, actionable analytics plan that tied data directly to user and business goals.

Collaborating with stakeholders to define north star metrics, OKRs, and KPIs turned complex data needs into a clear, unified vision for measuring success.
Selecting the right analytics tools was critical to balancing data accuracy, privacy, and accessibility during the migration from My HealtheVet to VA.gov.
I adopted Datadog as the primary analytics platform for quantitative web data, since VA’s Google Analytics 4 instance wasn’t yet available at launch.
I prioritized Veteran privacy by choosing Datadog for its ability to hash sensitive data, ensuring protection of personally identifiable and health information.
I maintained legacy comparisons by continuing SQL queries from the My HealtheVet database to track usage trends during the transition.
I expanded visibility into user feedback by securing access to Veteran surveys and help desk tickets for all products, integrating qualitative data into the broader analytics ecosystem.
Choosing the Right Tools for Secure, Scalable Data Collection

By aligning our data tools with privacy and reliability standards, I built a secure analytics foundation that protected Veteran data while expanding what we could measure and learn.
Implementing Datadog for Scalable, Secure Data Insights
To build a sustainable analytics infrastructure, I partnered closely with developers and product stakeholders to fully implement and optimize Datadog for the 3 new VA.gov My HealtheVet products.
I collaborated with developers to install the Datadog agent within the front-end code and create custom tags for precise event tracking.
I extended data retention by researching and configuring custom metrics that preserved usage data for up to 15 months, addressing Datadog’s default 30-day expiration limit.
I designed stakeholder dashboards that made real-time product metrics accessible and easy to interpret, earning praise from VA product owners for clarity and usability.
I empowered teams through training, showing researchers, designers, and PMs how to explore custom metrics and track the data most relevant to their goals.
By optimizing Datadog’s setup and usability, I turned short-term analytics into long-term insights, creating dashboards and data practices that empowered the entire team to make informed, data-driven decisions.
Transforming Data into Direction for VA Product Teams
Once data collection systems were in place, I led monthly, then quarterly analytics reporting across all three My HealtheVet products on VA.gov, Secure Messaging, Medications, and Medical Records.
I delivered comprehensive reports combining transaction data, performance indicators, and Veteran feedback (including CSAT).
I provided clear visibility into how Veterans were engaging with the new VA.gov experience compared to legacy tools, revealing both progress and persistent barriers.
I highlighted behavioral insights that guided product teams in prioritizing new features, refining design decisions, and addressing usability or performance issues.
I received consistent praise from VA product owners and researchers for the clarity and strategic value of the reports, which helped connect user behavior directly to business and mission goals.

By combining performance metrics with Veteran feedback, I helped stakeholders see not just what was happening, but why, turning analytics into actionable insight that directly informed product strategy.
Scaling Qualitative Insights Through Automation
As part of the analytics framework for each My HealtheVet product, I analyzed and synthesized Veteran feedback collected through Medallia’s feedback and intercept surveys.
I developed custom tagging systems for each product to categorize feedback by issue type, sentiment, and feature area.
I used Excel-based analysis to identify emerging patterns, surface usability issues, and alert teams to critical bugs in real time.
Early findings led directly to fixes, such as resolving a major data visibility bug within a day of it being reported by Veterans.
As feedback volume grew into the thousands per month, I created and trained a custom GPT model (with PHI and PII redacted) to automate tagging and sentiment classification.
While clunky and error-prone at first, over time, the model required fewer refinements, accelerating synthesis and delivery of insights to stakeholders.

By combining structured analysis with AI-powered tagging, I turned open-ended Veteran feedback into actionable insights, helping the team detect issues faster and improve the experience in real time.
Using Data to Shape Design Decisions
Beyond analytics and reporting, I used data to actively inform and influence product design strategy.
I advocated for usability testing by presenting data that revealed areas of confusion, low engagement, or unexpected user behaviors.
When additional testing wasn’t approved, I used real-time behavioral metrics to monitor new feature performance and uncover usability issues through data patterns.
I created interactive Mural boards combining qualitative and quantitative insights to visualize usage and track ongoing trends.
The VA Design Lead recognized the impact of this approach and requested additional Murals to track performance across our other My HealtheVet products.
Like the quarterly reports, these data boards became decision tools, helping teams prioritize enhancements and refine designs based on evidence, not assumptions.

By embedding data directly into the design process, I helped product teams move from reacting to issues, toward proactively improving the Veteran experience.
Turning Data Into Direction
This work redefined how our teams used analytics, moving from static reports to living systems of insight.
By building a unified framework for quantitative and qualitative data, I enabled teams to see beyond numbers and understand the why behind Veteran behavior.
Each dashboard, dataset, and report helped transform data into stories that guided decisions, prioritized fixes, and improved the Veteran experience.
Data isn’t just evidence of impact, it’s how we decide what matters next.